My Osirixplugin - T1 map calculation
Simple Osirix plugin to calculate T1 (longitudinal relaxation time) map.
How T1 was calculated?
Similarly to Messrogli et al. [1] approach, T1 was calculated by fitting equation parameters (A, B, T1star) to the data (each pixel), using Levenberg-Marquard algorithm.
y = A - B * exp(-t/T1star)
y is the pixel data vector, t is the inversion time vector, taken either from dicom metadata (either inversion time or image comments). Polarity correction as described in [1]. Then LL correction is made:
T1 = T1star*(B/A-1)
Calculations were made using VNL library [2]. Multithreading was applied to improve calculation speed (~15s on MacBook pro mid2012).
What images do I get?
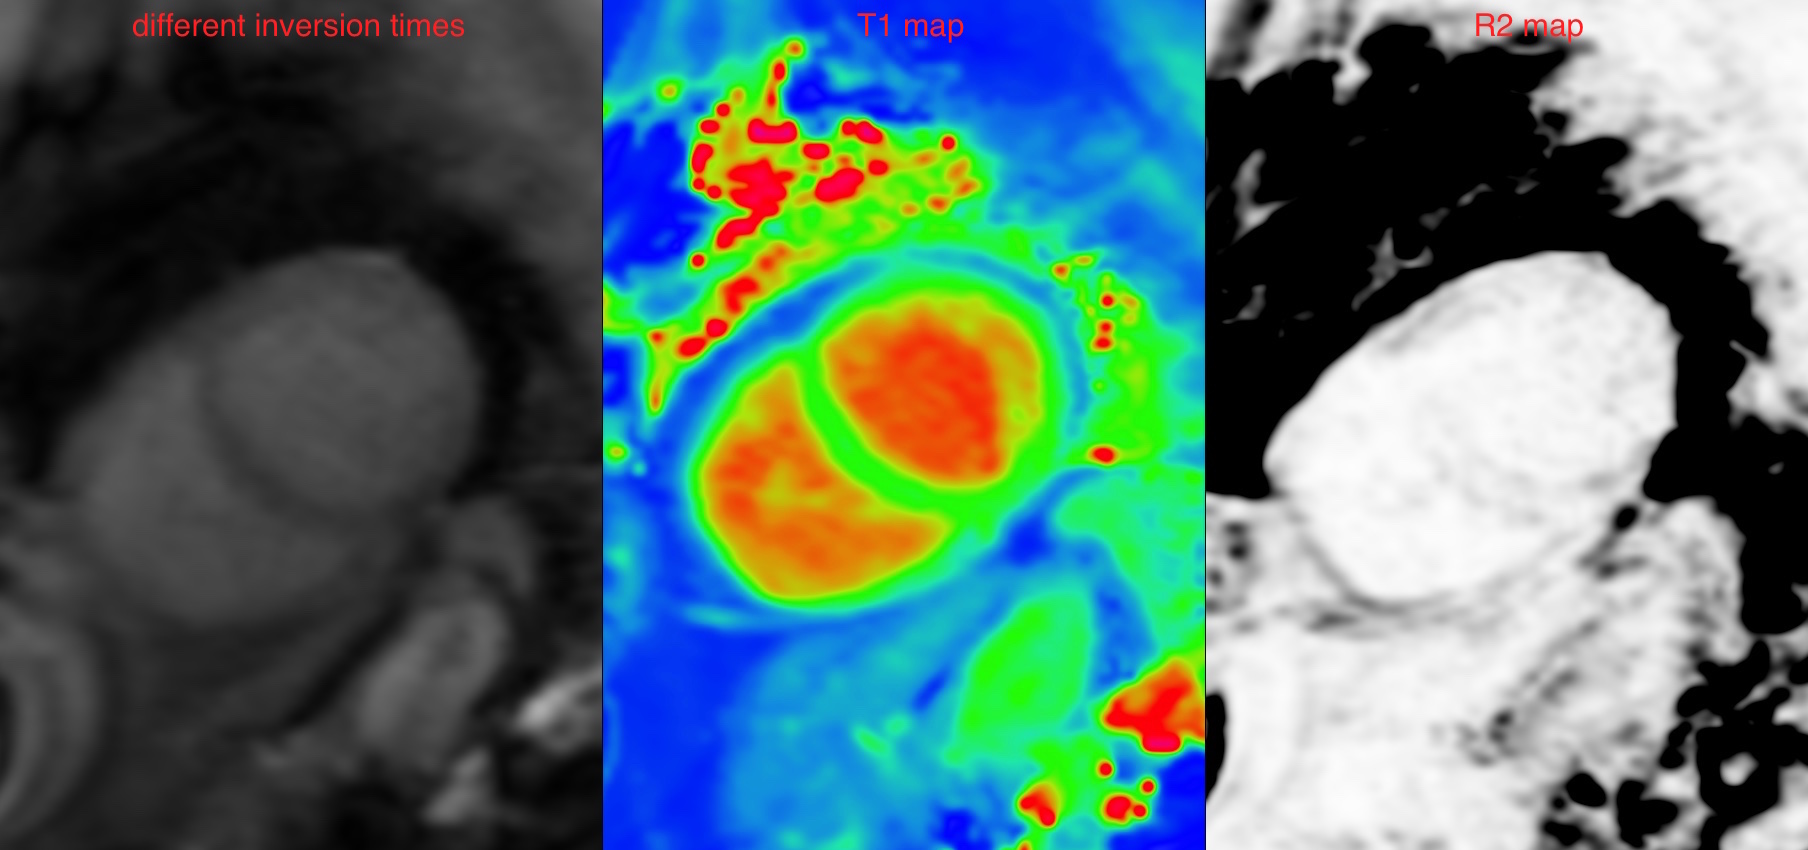
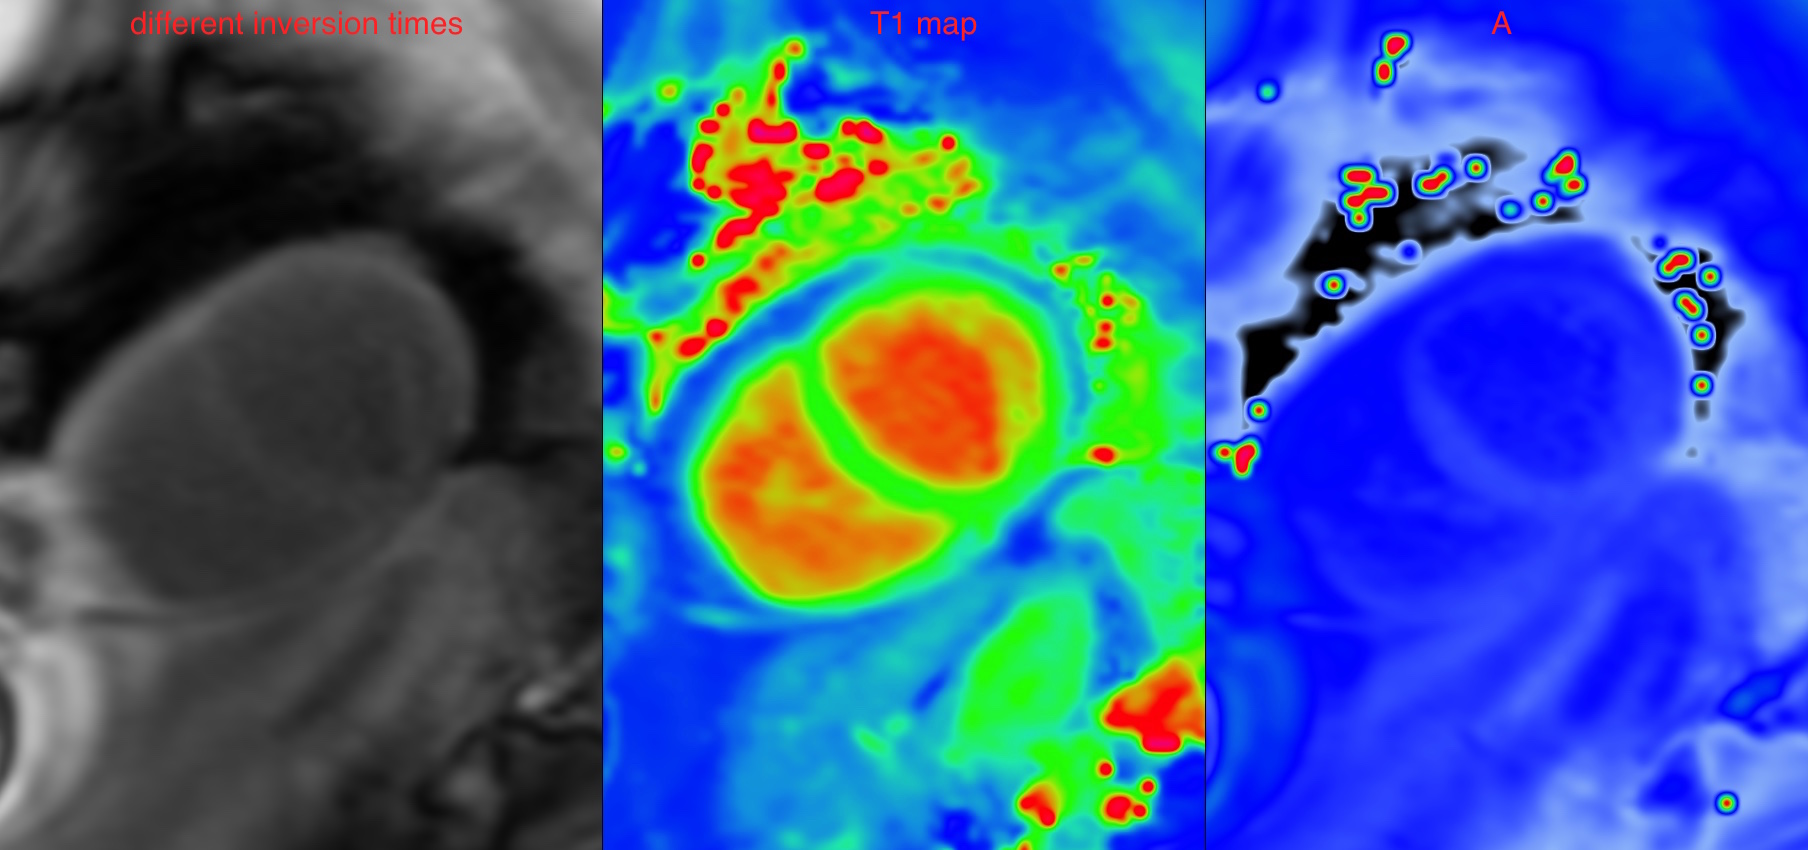
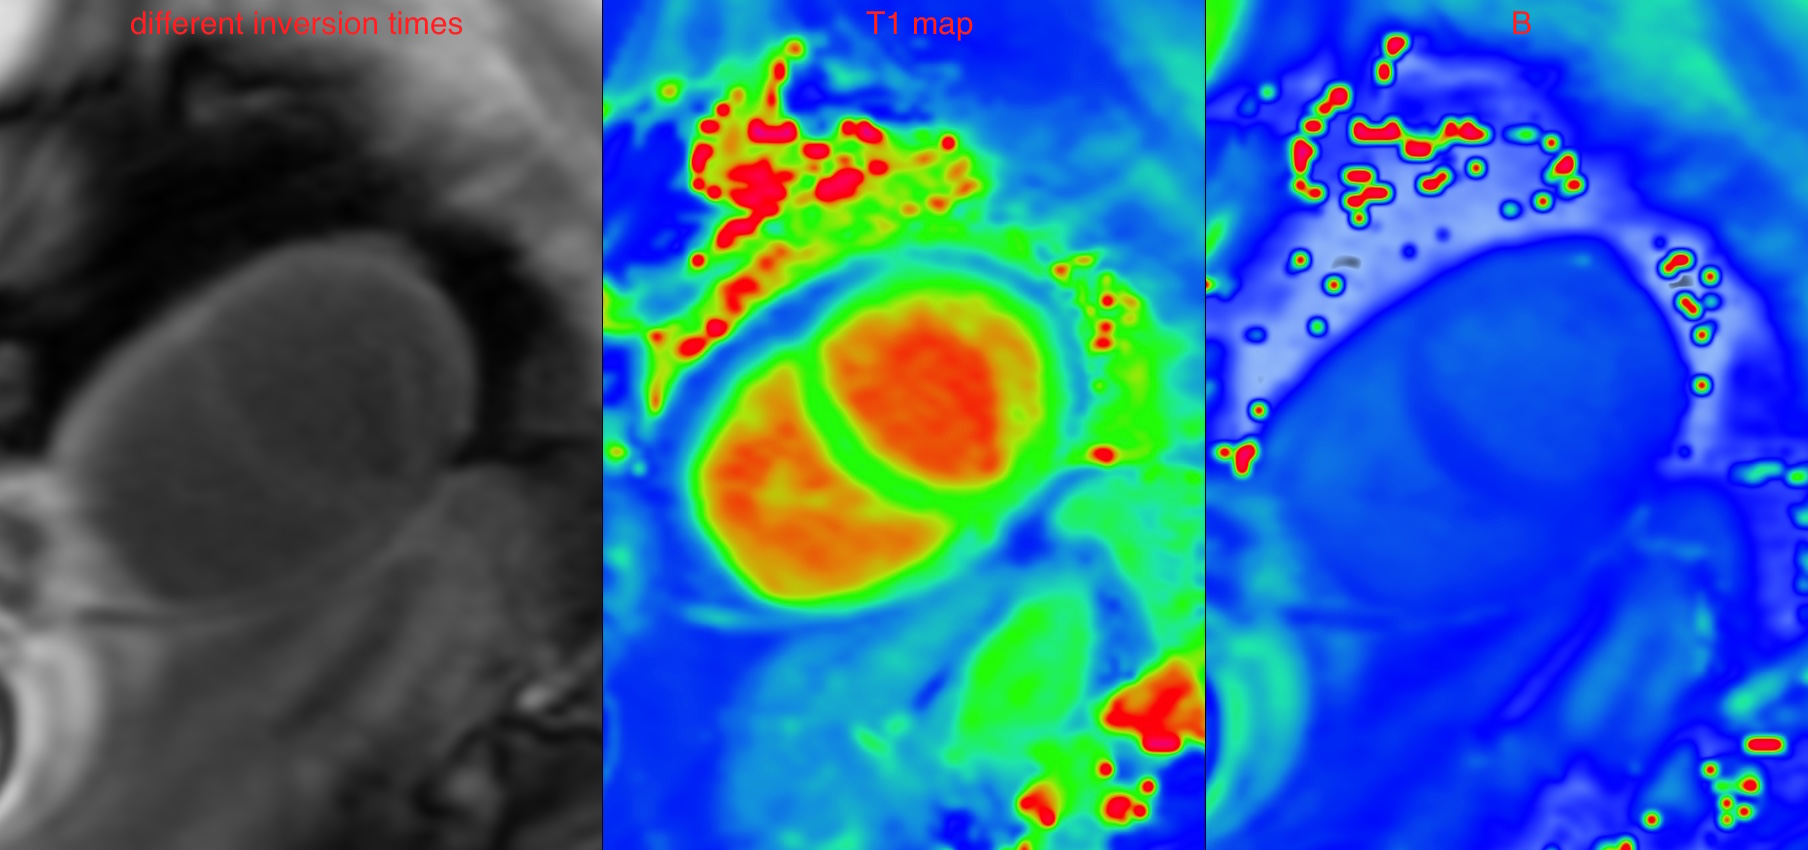
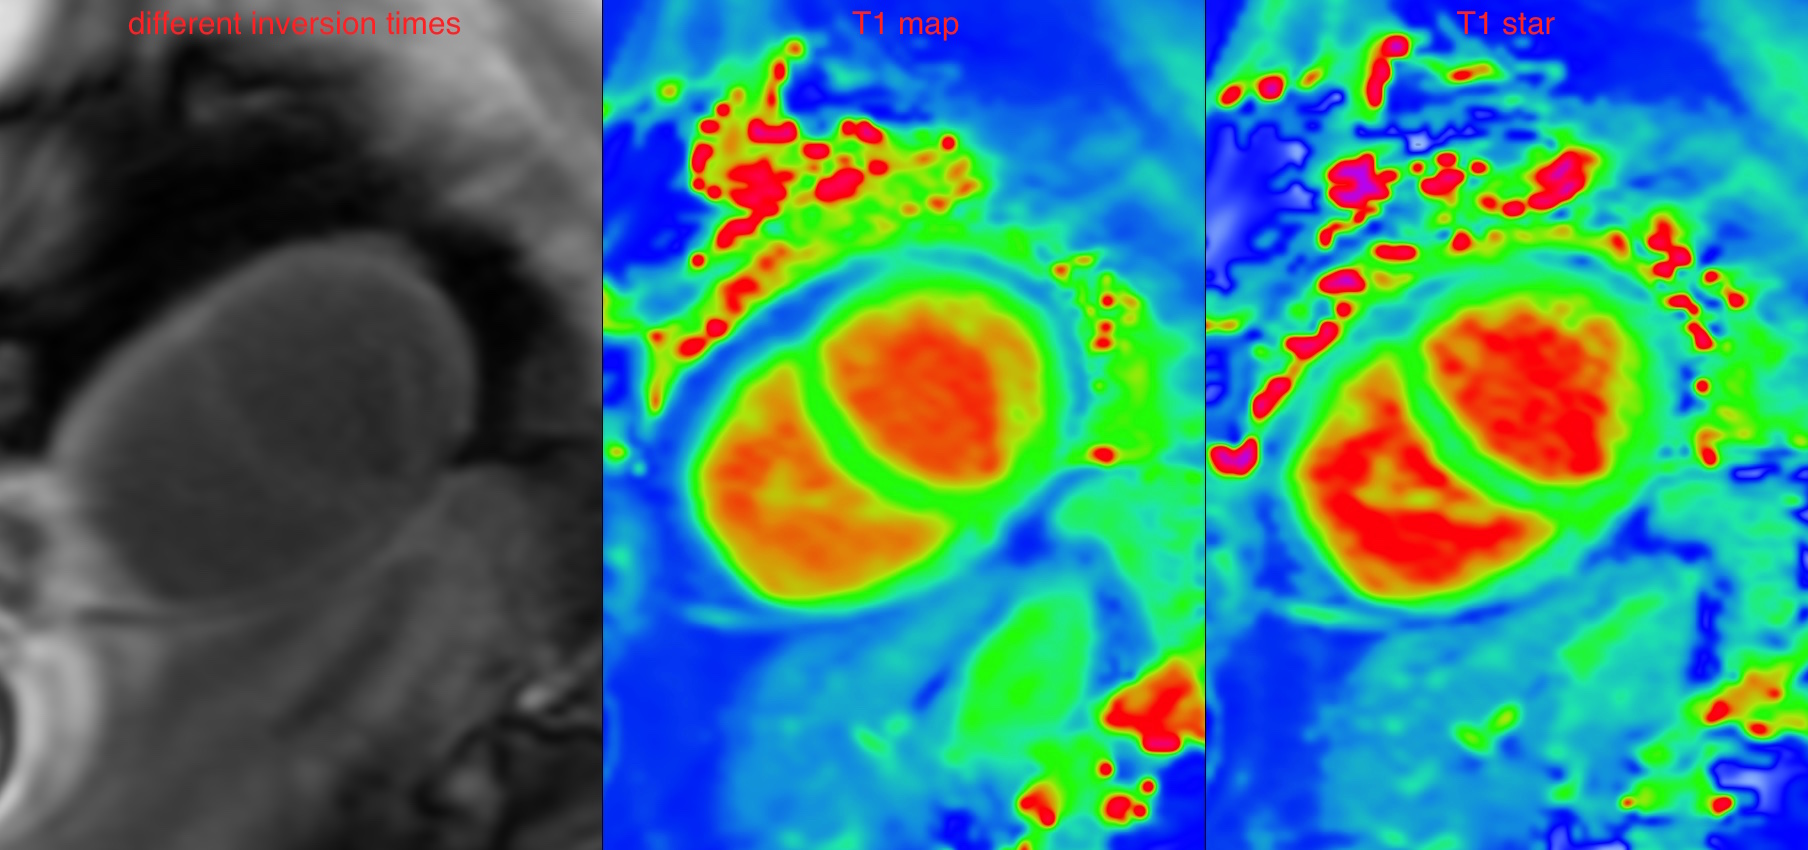
When you run the plugin, two windows are opened. One with T1 map (1 image). The second one contains 4 images:
R2(R square) is goodness of fit, calculated as in [3].Afrom equationy = A - B * exp(-t/T1star)Bfrom equationy = A - B * exp(-t/T1star)T1starfrom equationy = A - B * exp(-t/T1star)
Bibliography
[1] D. R. Messroghli, A. Radjenovic, S. Kozerke, D. M. Higgins, M. U. Sivananthan, and J. P. Ridgway, “Modified Look-Locker inversion recovery (MOLLI) for high-resolutionT1 mapping of the heart,” Magnetic Resonance in Medicine, vol. 52, no. 1, pp. 141–146, Jul. 2004.
[2] “VXL Documentation.” 01-Dec-2015.
[3] “Coefficient of determination,” Wikipedia, the free encyclopedia. 05-Nov-2015.